Johnson Truth Diagram
Drag a box on a graph to see how sensitivity, PPV, LRs and prevalence relate.
by Kevin M. JohnsonAdded to the directory Nov 3, 2026For education, not clinical use
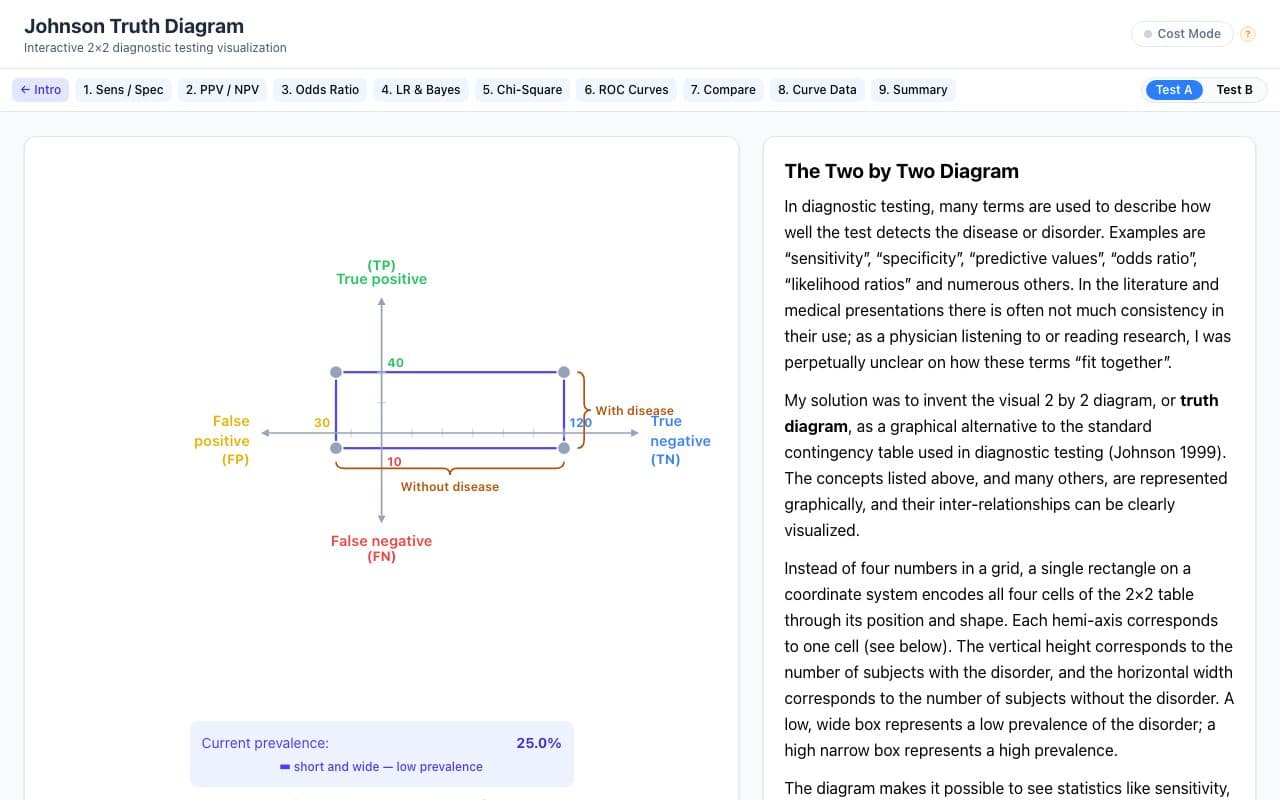
About Johnson Truth Diagram
An interactive version of the 'truth diagram' the author published in 1999 as a graphical alternative to the 2×2 table. Moving or resizing one rectangle changes prevalence and every derived statistic. Nine lessons cover sensitivity and specificity through ROC curves and comparing two tests.
What it does
- Draggable 2×2 box that updates all four cells and prevalence
- Nine lessons, sensitivity and specificity through ROC curves
- Likelihood ratios and Bayes' theorem shown geometrically
- Compare two tests side by side
- Cost mode for weighing false results
- References to the author's papers
Related tools

RAD at Hand
by Pooyan Khalighinejad
RADS calculators, ACR incidental-finding guidance and PACS-style radiology cases.
RadiologyFree, sign-up optional

RadioGyan
by Amar Udare
Radiology spotter and OSCE practice for residents preparing for exams.
RadiologyFree tier, sign-up optional

WNL
by Connor Tukel
Weekly AI summaries of what patients discuss in 1,000+ online communities.
Multi-specialtysign-up optionalUses AI